Archive
2016
Consequences
Refers to the unfortunate individual or societal impact of substance misuse.
-
Persons Killed in Alcohol-Related Motor Vehicle Crashes
VIEW STATISTICS -
Property Damage Motor Vehicle Crashes that are Alcohol-Related
VIEW STATISTICS -
Fatal Alcohol-Related Motor Vehicle Crashes
VIEW STATISTICS -
Alcohol-Related Motor Vehicle Crashes Causing Injury
VIEW STATISTICS -
Alcohol-Related Motor Vehicle Injuries
VIEW STATISTICS
Prevalence
Data answers questions of "how many" and data are typically presented in terms of percentages.
-
Comparison of 30-Day Substance Use Among High School Students (2015-2016)
VIEW STATISTICS -

30-Day Use of Electronic and Tobacco Cigarettes by Demographics, High School (2015-2016)
VIEW STATISTICS -
30-Day Use of Painkillers by Demographics, High School Students (2015-2016)
VIEW STATISTICS -

Use of Prescription Painkillers in the Past 30-Days, Middle and High School (2015-2016)
VIEW STATISTICS -
30-DAY YOUTH ALCOHOL USE AND BINGE DRINKING BY GENDER (2015-2016)
VIEW STATISTICS -
30-DAY DRINKING AND DRIVING AMONG HIGH SCHOOL YOUTH (2015-2016)
VIEW STATISTICS -
30-DAY YOUTH ALCOHOL USE AND BINGE DRINKING BY RACE / ETHNICITY (2015-2016)
VIEW STATISTICS -

30-DAY YOUTH MARIJUANA USE, BY GENDER AND RACE / ETHNICITY (2015-2016)
VIEW STATISTICS
Risk/Protective Factors
Refers to aspects in an individual's life which encourage or deter them from using substances.
-
Peer Disapproval of Marijuana Use (2015-2016)
VIEW STATISTICS -

Students Who Have Seriously Considered Suicide (2015-2016)
VIEW STATISTICS -
Students Who Have Made a Plan About How to Attempt Suicide (2015-2016)
VIEW STATISTICS -
Students Who Have Attempted Suicide (2015-2016)
VIEW STATISTICS -
Percentage of Students that See Regular Consumption as a Risk (2015-2016)
VIEW STATISTICS -
Disapproval of Peer Alcohol Use (2015-2016)
VIEW STATISTICS -
Parents Who Would Not Know if Their Child Came Home on Time (2015-2016)
VIEW STATISTICS -
Parents Who Tell Their Student They’re Proud (2015-2016)
VIEW STATISTICS -
Parents Who Notice Their Student is Doing a Good Job (2015-2016)
VIEW STATISTICS -
Negative Perception of Consumption by Peers (2015-2016)
VIEW STATISTICS -
Available Neighbors Students Feel They Can Talk To (2015-2016)
VIEW STATISTICS -
Age of Onset of Alcohol and Marijuana Use (2015-2016)
VIEW STATISTICS -
Trends in Perceived Risk of Harm due to Marijuana, by Gender and Race / Ethnicity (2015-2016)
VIEW STATISTICS -
Students Who Have Seen Other Students Be Physically Bullied (2015-2016)
VIEW STATISTICS -
Parental Disapproval of Youth Use of Alcohol and Marijuana (2015-2016)
VIEW STATISTICS -
Availability of Alcohol / Marijuana (2015-2016)
VIEW STATISTICS
2015
Consequences
Refers to the unfortunate individual or societal impact of substance misuse.
-
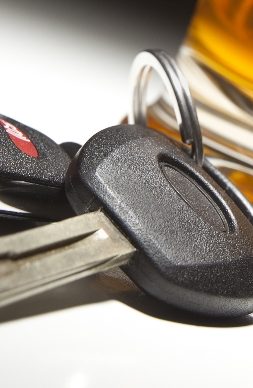
Operating Under the Influence of Alcohol
VIEW STATISTICS -
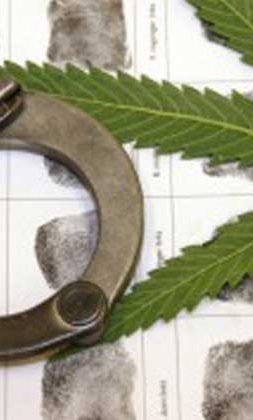
Marijuana Offenses
VIEW STATISTICS -
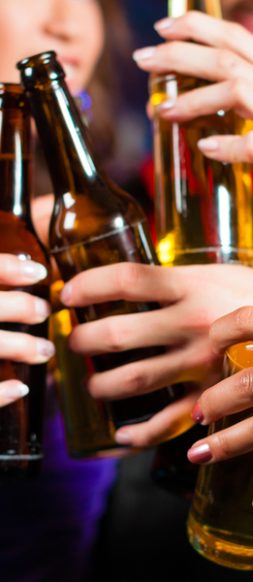
Minor in Possession of Alcohol
VIEW STATISTICS
2014
Prevalence
Data answers questions of "how many" and data are typically presented in terms of percentages.
-
30-DAY DRINKING AND DRIVING AMONG HIGH SCHOOL YOUTH
VIEW STATISTICS -
30-DAY ADULT (18 YEARS AND OLDER) ALCOHOL USE, BY AGE
VIEW STATISTICS
Risk/Protective Factors
Refers to aspects in an individual's life which encourage or deter them from using substances.
-
Parental Disapproval of Youth Use of Alcohol and Marijuana (2013-2014)
VIEW STATISTICS -
Availability of Alcohol / Marijuana
VIEW STATISTICS -
Students Who Have Attempted Suicide (2013-2014)
VIEW STATISTICS -
Students Who Have Made a Plan About How to Attempt Suicide
VIEW STATISTICS -
Students Who Have Seriously Considered Suicide
VIEW STATISTICS -
Students Who Have One Best Friend that Tried to Do Well in School (2013-2014)
VIEW STATISTICS -
Students Who Have One Best Friend that Likes School (2013-2014)
VIEW STATISTICS -
Students Who Have One Best Friend who Attends Religious Services (2013-2014)
VIEW STATISTICS -
Students Who Have One Best Friend Who Commit to Being Drug-Free (2013-2014)
VIEW STATISTICS -
Students Who Thought None or Some of Their Friends Had Been Drunk Recently (2013-2014)
VIEW STATISTICS -
Students with People in Their Family that Have Serious Arguments (2013-2014)
VIEW STATISTICS -
Students Who Could Ask a Parent for Help with Personal Problems (2013-2014)
VIEW STATISTICS -
Parents Who Tell Their Student They’re Proud (2013-2014)
VIEW STATISTICS -
Parents Who Notice Their Student is Doing a Good Job (2013-2014)
VIEW STATISTICS -
Students Who Enjoy Spending Time With Their Father
VIEW STATISTICS -
Students Who Enjoy Spending Time With Their Mother
VIEW STATISTICS -
Parents Who Would Not Know if Their Child Came Home on Time (2013-2014)
VIEW STATISTICS -
Parents Who View Regular Consumption As Wrong (2013-2014)
VIEW STATISTICS -

Students Who Have Driven With Someone Who Had Drank (2013-2014)
VIEW STATISTICS -
Students Who Feel Unsafe in Their Neighborhood (2013-2014)
VIEW STATISTICS -
Available Neighbors Students Feel They Can Talk To
VIEW STATISTICS -
Students Who Seldom / Never Did Their Best Work at School (2013-2014)
VIEW STATISTICS -
Students Who Think Learning in School is Not Important (2013-2014)
VIEW STATISTICS -
Students Who Felt So Sad / Hopeless Almost Every Day for Two Weeks or More in a Row That They Stopped Doing Some Usual Activities During the Past 12 Months
VIEW STATISTICS -
Negative Perception of Consumption by Peers (2013-2014)
VIEW STATISTICS -
Percentage of Students that See Regular Consumption as a Risk (2013-2014)
VIEW STATISTICS -
Students Who Consumed Alcohol Before Having Sexual Intercourse (2013-2014)
VIEW STATISTICS -
Disapproval of Peer Alcohol Use (2013-2014)
VIEW STATISTICS -
Students that Have Ever Consumed (2013-2014)
VIEW STATISTICS -
Age of Onset of Alcohol and Marijuana Use
VIEW STATISTICS -
Alcohol Consumption in the Last 30 Days (2013-2014)
VIEW STATISTICS -
Students Who Have Binge Drank (2013-2014)
VIEW STATISTICS -
Students Who Have Drank and Driven (2013-2014)
VIEW STATISTICS
2013
Consequences
Refers to the unfortunate individual or societal impact of substance misuse.
-
Substance Abuse Arrests
VIEW STATISTICS -
Juvenile Arrests for all Substance Violations Based on Race / Ethnicity
VIEW STATISTICS -
Juvenile Arrests for Liquor Violations Based on Race / Ethnicity
VIEW STATISTICS -
Juvenile Arrests for Controlled Substance Violations Based on Race / Ethnicity
VIEW STATISTICS -
Number of Persons Injured in Alcohol-Related Motor Vehicle Crashes
VIEW STATISTICS